Fuel prices in the European Union
Prices are updated every week. Taxes included.
EuroFuels
Fuel prices across all 27 EU member states, on a map.
Live app · Frontend source · Backend source
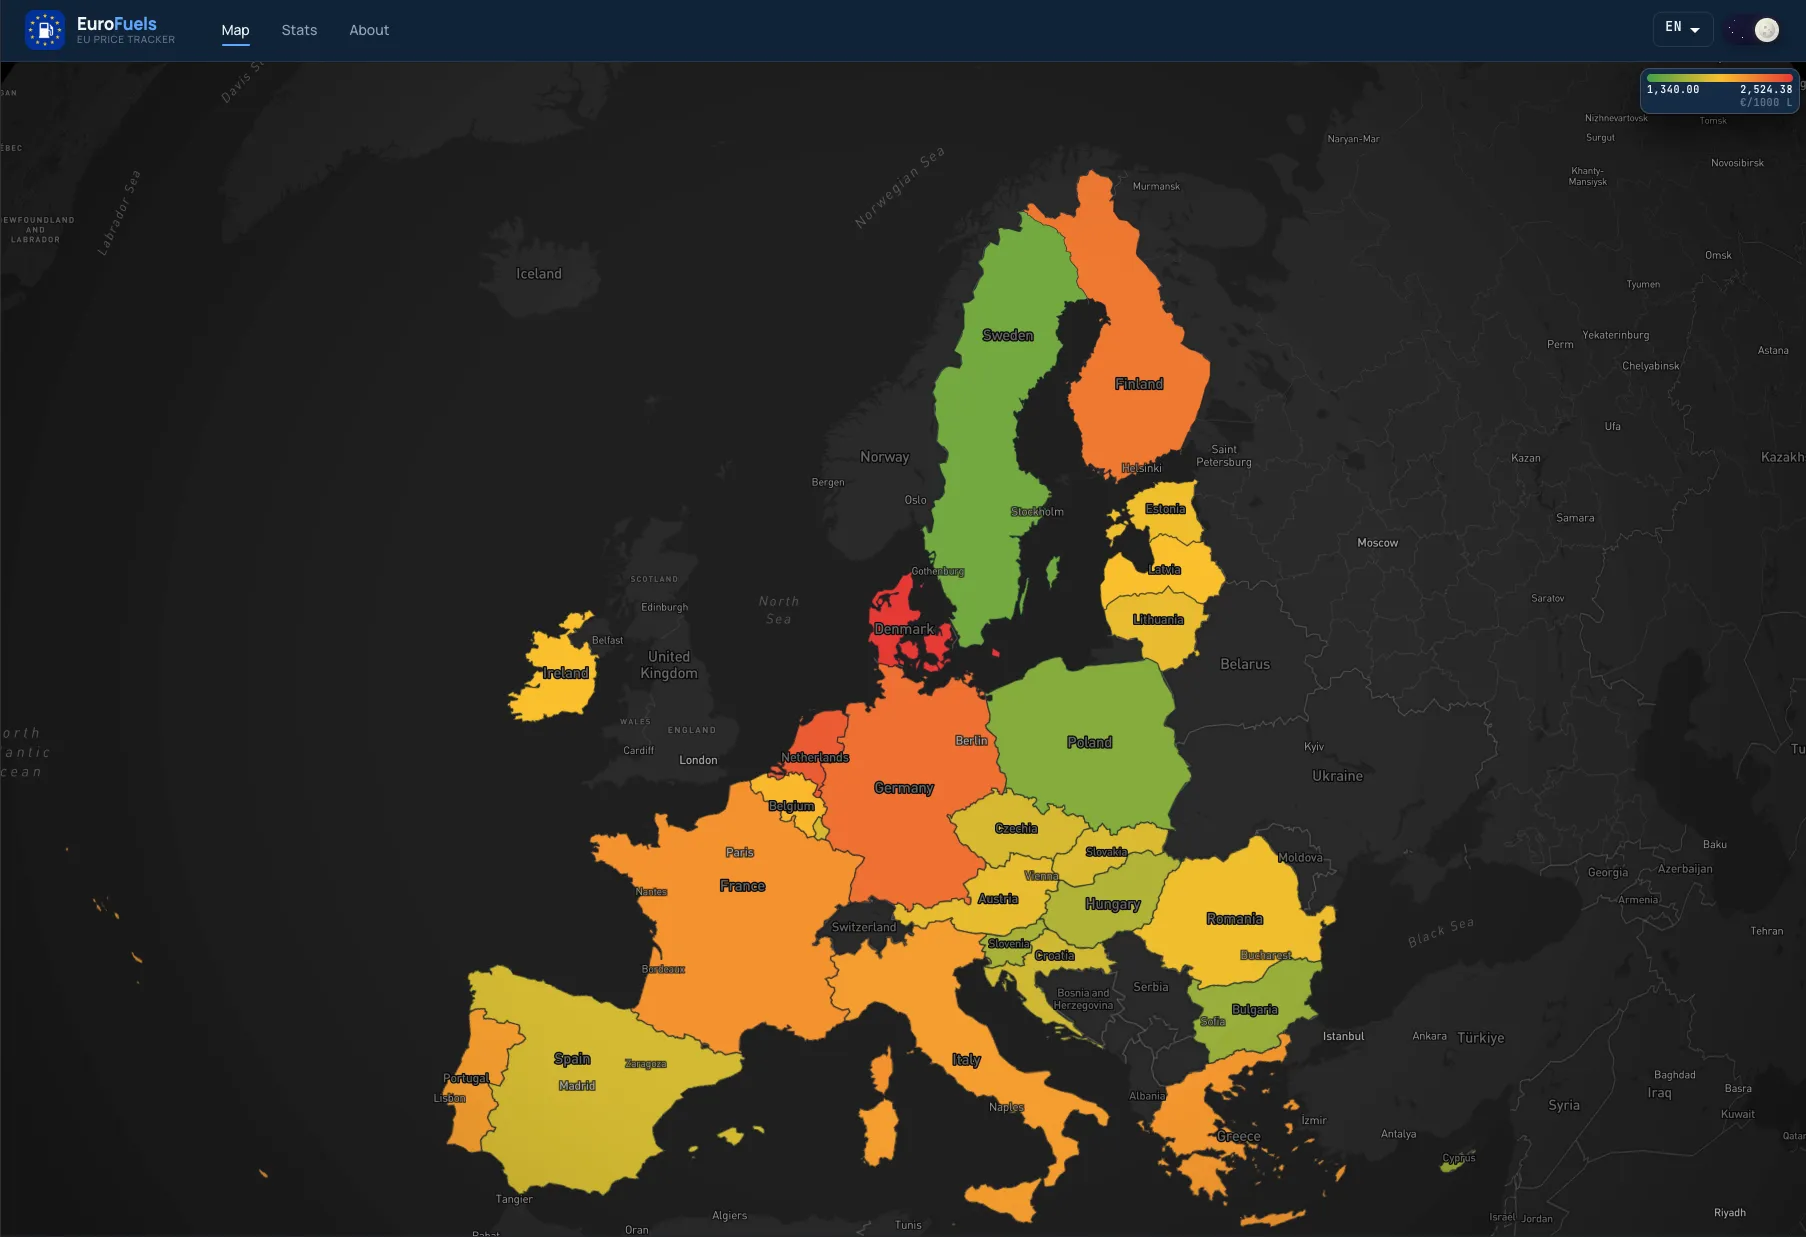
Fuel prices vary wildly across EU borders, but there’s no easy way to compare them at a glance. EuroFuels puts every member state’s petrol and diesel price on one interactive map.
What it does
-
Interactive map of all 27 EU states — click a country to see its petrol and diesel price
-
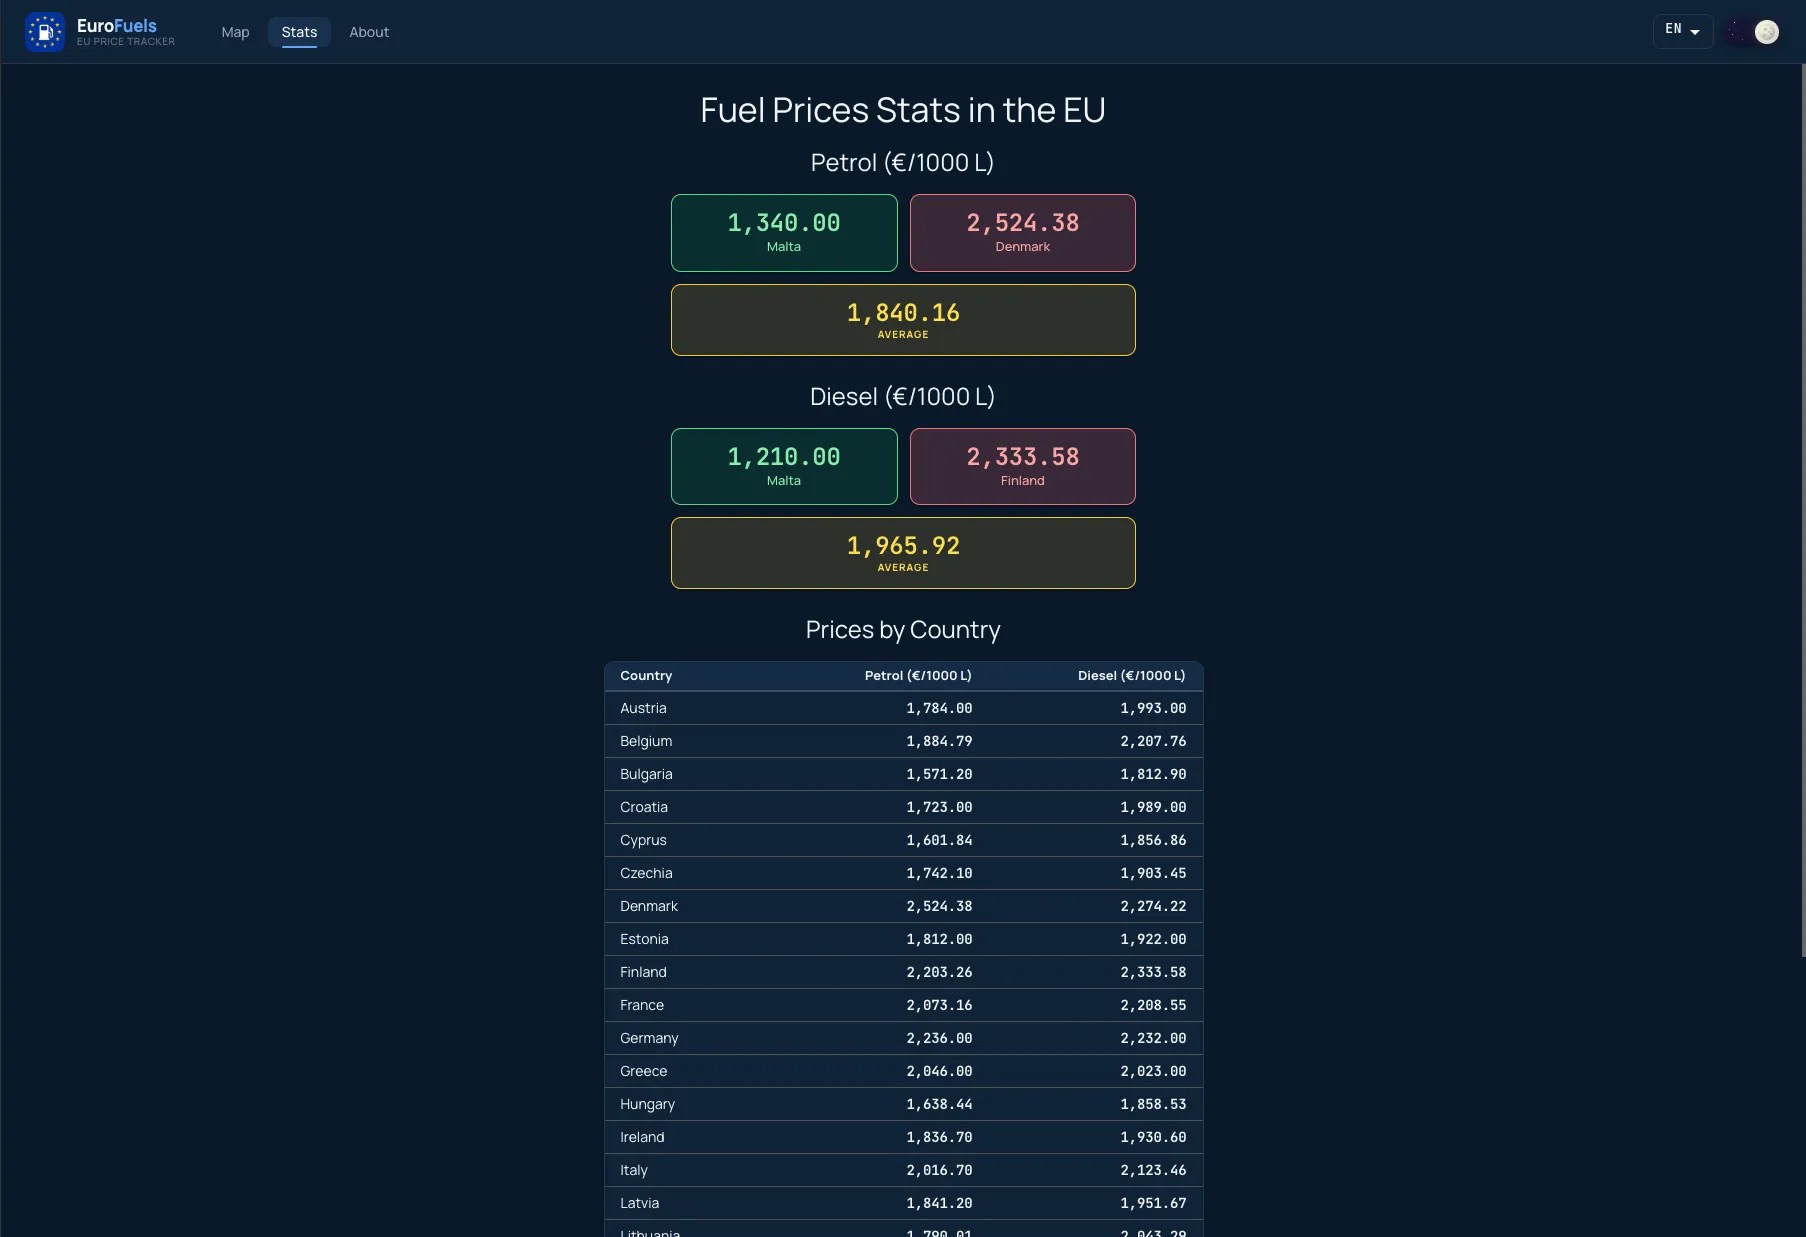
Stats view with a sortable table comparing every country side by side, plus EU-wide averages
-
English and Spanish, light and dark mode (dark by default)
-
Prices sourced from the EU’s official Weekly Oil Bulletin, refreshed automatically
How it’s built
React 19 + TypeScript, MUI, Mapbox GL JS for the map, SWR for data fetching, React Router v7 in framework mode.
- Shared component library — built on
@macolmenerori/component-library, a package I publish and maintain myself, so design changes propagate across all my projects instead of being copy-pasted between them. - Deploy pipeline — every pull request runs a full verification gate (audit, lint, typecheck, tests, build) in GitHub Actions; releases sync the static build to S3 and invalidate CloudFront. Also ships as a Docker image for a one-command local run.
- Serverless backend — a Python AWS Lambda, triggered weekly by EventBridge, parses the European Commission’s official Weekly Oil Bulletin spreadsheet and writes the result as a JSON file to a public S3 bucket. No server, no database — the “API” is a static file, refreshed on a schedule.
Take a look at the live app — good way to check before a road trip across borders.