cyl-polen-tracker
Pollen level tracker for Castilla y León (Spain).
CyL Pollen Tracker
Pollen levels across Castilla y León, on a map.
Castilla y León’s regional government publishes pollen readings through its open-data portal as raw records — accurate, current, and unusable to anyone who isn’t parsing JSON for fun. I turned that feed into a map you can glance at and actually understand.
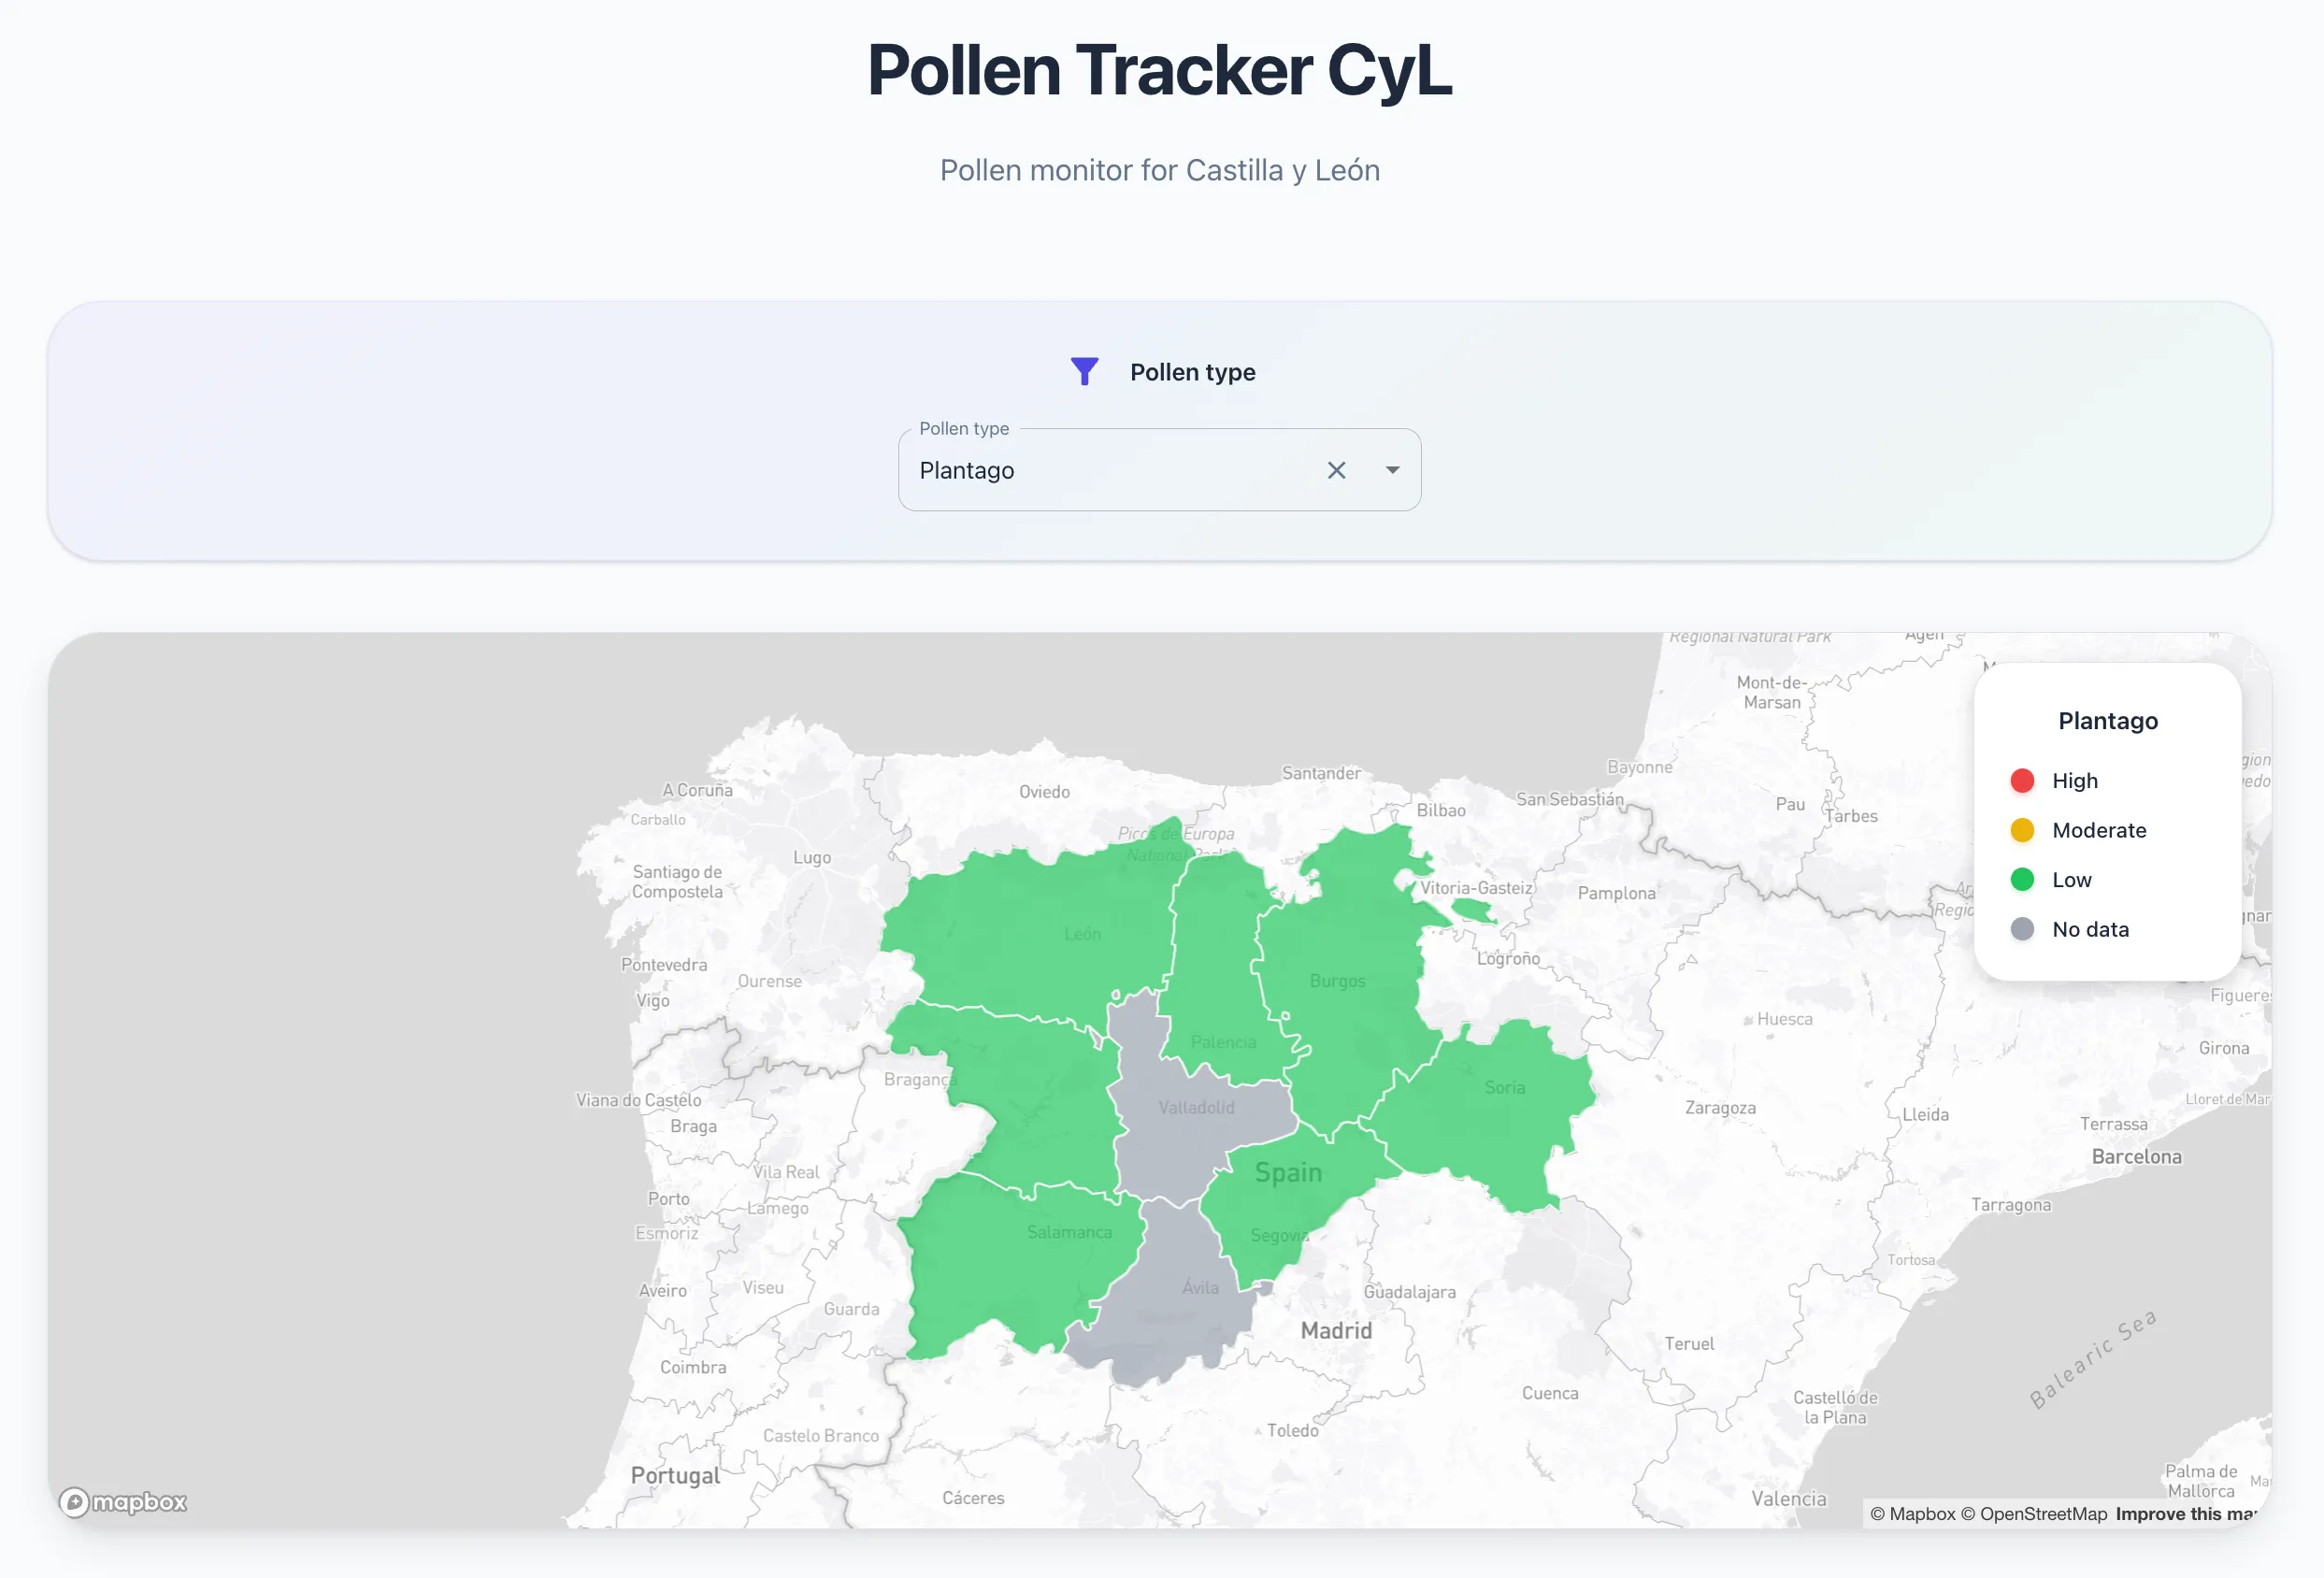
What it does
- Choropleth map of the nine provinces, coloured by level for the selected pollen type
- Filter by pollen type to see how it varies across the region
- Spanish and English, light and dark mode
- Live data pulled straight from the official JCyL open-data API, cached client-side
How it’s built
React 19 + TypeScript, MUI, Mapbox GL JS with a custom province boundaries layer, and SWR for data fetching. The app is statically pre-rendered with vite-react-ssg so it loads fast and indexes well.
- Shared component library — the UI is built on
@macolmenerori/component-library, a package I publish and maintain myself, so design changes propagate across all my projects instead of being copy-pasted between them. - Deploy pipeline — every pull request runs a full verification gate (audit, lint, typecheck, tests, build) in GitHub Actions; releases sync the static build to S3 and invalidate CloudFront. Also ships as a Docker image for a one-command local run.
- Beyond the browser — a companion AWS Lambda endpoint reshapes the same data for a TRMNL e-ink display, so the pollen count also shows up on a little screen on my desk.
Take a look at the live app — it’s genuinely how I check the pollen count these days.